Why Use an Insurance Infographic?
Let's face it. Insurance and technology topics can be boring and complex too.
To really catch the attention of your audience, and to compete with all the other messages out there, it’s good to simplify communication and "fun" things up a bit. Infographics make your message more impactful, highlight important details and encourage clicks and social shares.
Count on Infographics to Clarify Your Message
65%
of people are visual learners. (Social Science Research Network)
5%
of marketers surveyed said infographics and other original graphics earned more engagement than other types of visuals.
Infographics
help you GO VISUAL with otherwise boring content. They simplify complex messages and hook readers with engaging graphics.
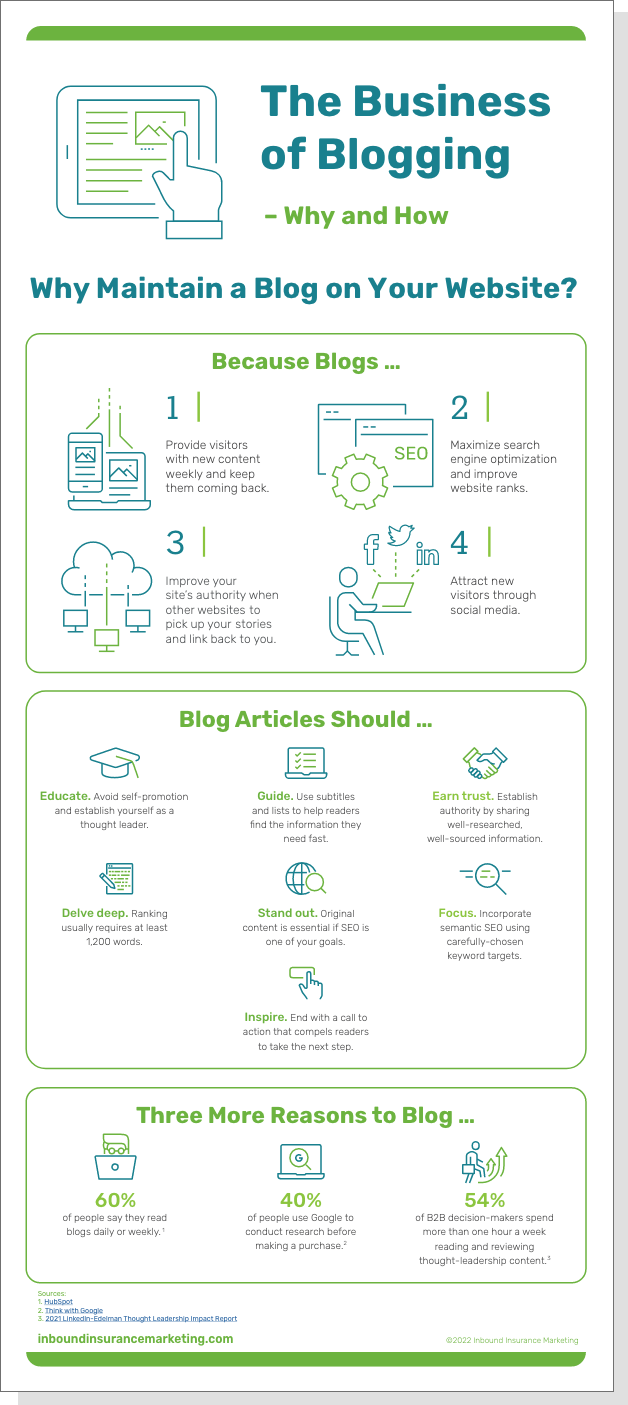
Here's an Example ...
Infographic FAQ's
Just as the name suggests, an infographic is a type of graphic that conveys information. It’s not the same as a chart. Instead, it’s a visual representation of information that usually includes key points and statistics. It looks like a poster filled with helpful information.
According to Social Science Research Network, the majority of people – 65 percent of them – are visual learners. Infographics are a great way of presenting information in a visually appealing way. Infographics are also highly scannable, which makes them perfectly suited for the way most people view content online. Instead of bogging people down with too many details all at once, infographics highlight key points. This also ensures that your readers get exactly the takeaways you want.
Definitely. Good infographics will attract people to your site. Infographics can also help you get backlinks to your site, one of the hardest aspects of SEO.
Yes! Blog posts are great, but they’re even better with infographics. You can combine text-based posts with infographics, or you can publish infographics separately. Either way, including infographics will make your website more appealing to a wider range of people.
There are two key parts to a good infographic: the information and the look. A good infographic needs good information. It should focus on simple key points and important statistics. It also needs to look appealing, and the information needs to be presented in a clear, easy-to-digest manner.


